
Digital marketing has grown by leaps and bounds over the years. It has taken over the advertising arena and improved it tenfold. While increasing your digital marketing reach will only bring more revenue to your organization, it will also make it harder to keep a track of all your digital marketing accounts. When putting together your digital marketing reports, one would have to jump from one site to another to get a hold of all the raw data, take screenshots, and combine it into an excel sheet. One would then have to create graphs, charts and add his/her comments to the reports. What if you could save all this time?
Enter Whatagraph. Whatagraph is a business intelligence software created with one goal in mind. To bring down the time needed to create digital marketing reports from hours to minutes. Whatagraph creates analytics reports automatically; and if you want it to, it will share the reports with clients or group members in line with your desired frequency. The software is armed with a central dashboard to give you a brief overview of website performance in a few seconds and share it. One also has the choice to download the reports as PDF for printing out copies. Let’s take a look at some of the major features that Whatagraph has to offer.
Features of Whatagraph
Data Origin Unification
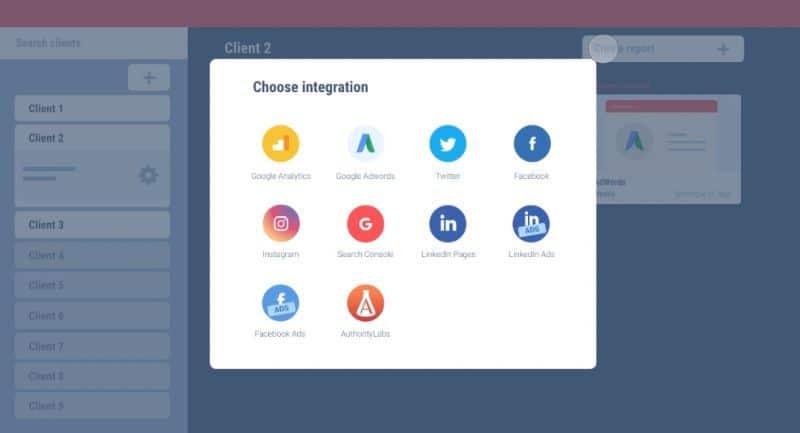
Image Source : whatagraph.com
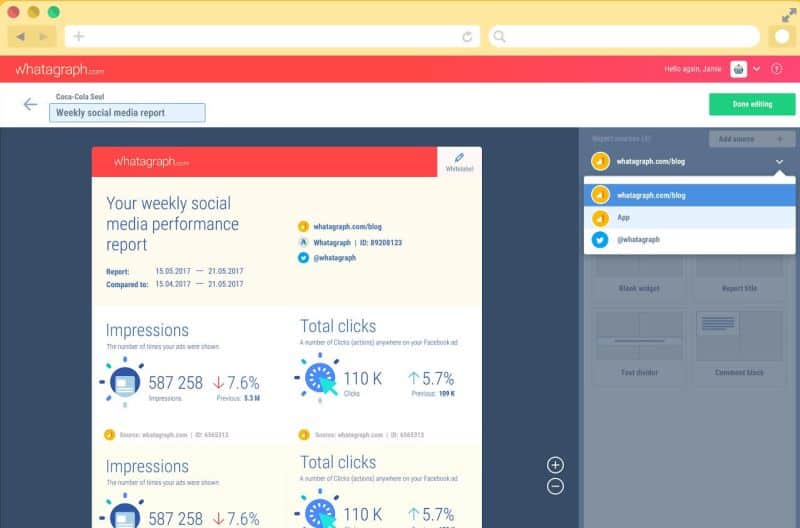
With Whatagraph, you can combine data from multiple social media and other websites into lucid, visual data. The capability of collecting data from more than 10 sources makes Whatagraph one of the most advanced Business Intelligence Softwares in the market. From Google Analytics and Adwords, Search Console to social media platforms like Facebook, Instagram, Linkedin, Youtube, Twitter and Facebook Ads, Whatagraph is extremely versatile. One can add more than ten sources to extract data from at a nominal price. This feature allows users to source data from as many as twenty different channels. All you have to do is connect your data sources and leave the rest to Whatagraph.
Data Automation
Image Source : whatagraph.com

This is where Whatagraph shows its real magic. Once you build the report, Whatagraph gets to work and starts to read all the data and arrange it for better understanding. The entire unification process is automatic. The software is designed to make sense of the information and transform it into understandable reports. The compiled report will then be sent to your email inbox for analysis and sharing. You can imagine how long it would take you to do this task manually, especially if you have quite a few clients with medium to large digital marketing budgets. Surely, you are saving a lot of time and hard work associated with data collection and analysis. You can use this time to brainstorm ideas with your team members on how you can enhance the professional performance.
Modifiable Data Reporting
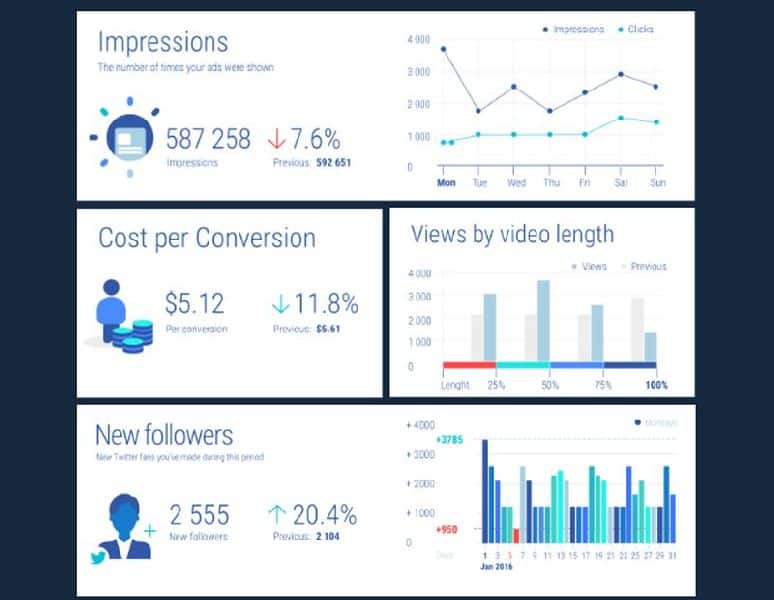
Image Source : whatagraph.com
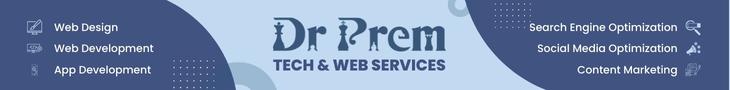
Whatagraph also allows you to create reports based on your requirement. You can input the time period between two dates to generate a report for that duration in addition to weekly and monthly reports. You may also choose to select key performance indicators and statistics of your choice. This provides a good deal of flexibility when generating reports for a detailed analysis. If you just want to give your client an overview, you can select fewer parameters in order to not overwhelm him/her with unnecessary data.
Easy to understand Data Visualization
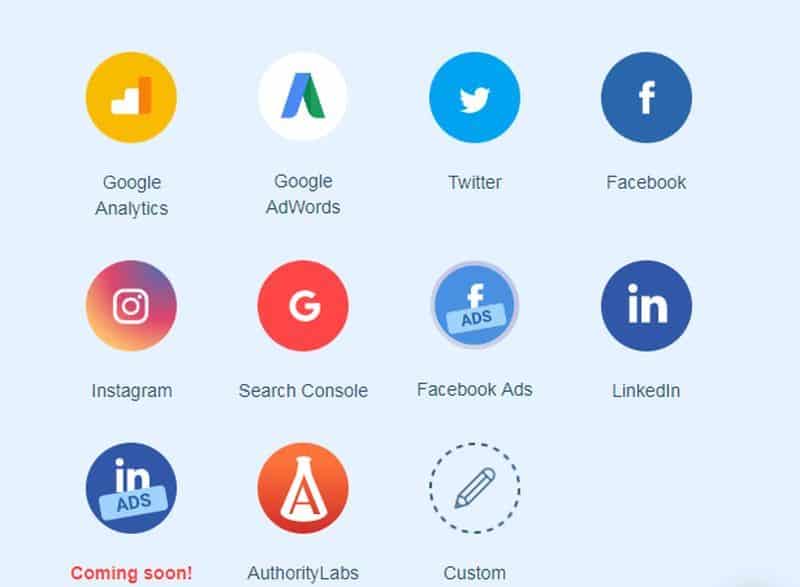
Image Source : whatagraph.com
All this report generation is useless if one cannot understand what they say. Whatagraph builds reports that are easy to read and comprehend. These reports can be used in presentations right away. As the data is easier to understand, it drives everyone to brainstorm ideas and ask questions. Engagement grows and everyone is motivated to contribute their own ideas. It allows everyone involved to envision performance and channel growth better.
Conclusion
Whatagraph is a user-friendly tool designed to streamline your digital reporting problems. Digital marketing agencies all over the globe have adopted Whatagraph because of all the benefits it has to offer. The digital marketing reports produced by Whatagraph is helping businesses save hours of manual tasks per client. Visually appealing charts and graphs also help start conversations, as non-technical clients are able to grasp and understand reports better. This helps establish better client-customer relationships and increase marketing budget.